U.S. Wind & Solar Capacity Factors Over Time
We look at wind & solar capacity factors by plant operating year

Renewable capacity factors are generally low - U.S. wind is roughly 34%, while solar is 20%
We take a look at wind and solar capacity factors by year of operation to look at trends and the trajectory of change
Capacity Factors by Year of First Operations
EIA provides monthly plant-level generation data for a sample of power plants. Wind and solar plants in the monthly data represent approximately 2/3 of all U.S. wind and solar generation.
Data is based on trailing 12-month generation relative to capacity through February 2022. Plants that began operations in 2021 were removed to avoid low implied capacity factors from partial year start-ups.
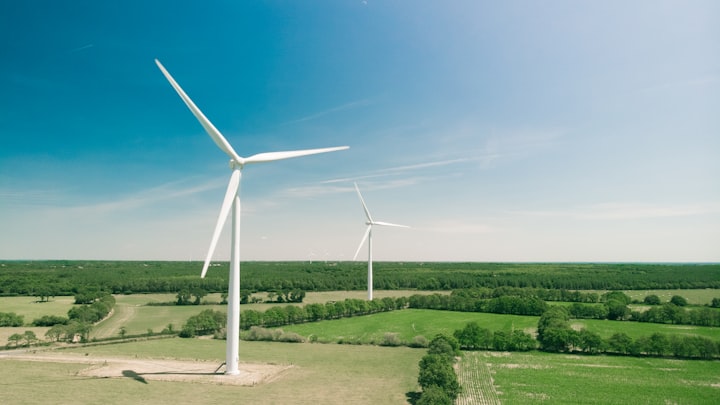
Wind capacity factors have improved over time. Better siting, bigger and better turbines and higher turbine heights all play a role, among other factors. A number of offshore wind projects are in the planning and construction stages in the U.S. that will push aggregate capacity factors even higher.
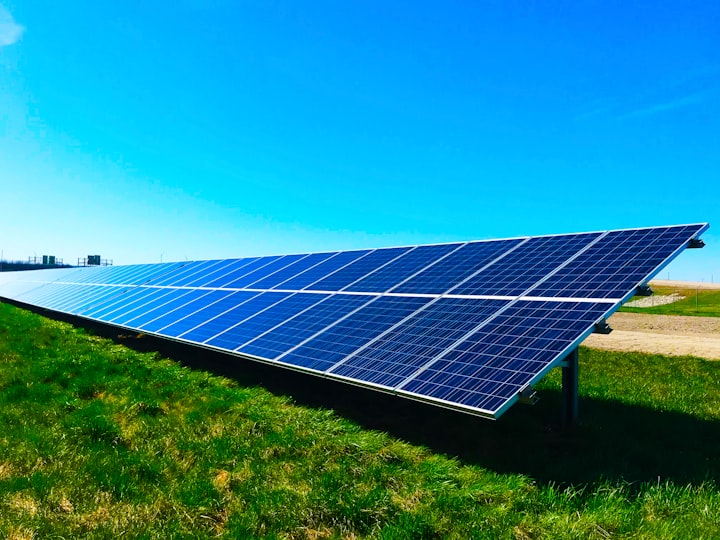
Solar capacity factors have also improved with time but at a slower pace. As we've noted in past work, U.S. wind is most often sited where the best wind is - middle America and in the future, offshore. Solar has more widespread locational advantages, but the capacity factor improvements have been slower.
Please note the individual plants and capacity factors are shown on the chart on hover.