20-Years of U.S. Power Generation Visualized
20-Years of US Power Generation Changes

💡
As the saying goes, a picture tells 1,000 words
U.S. power generation since the early 2000's is visualized
It is apparent the U.S. power grid is a mosaic of demand and generation changes
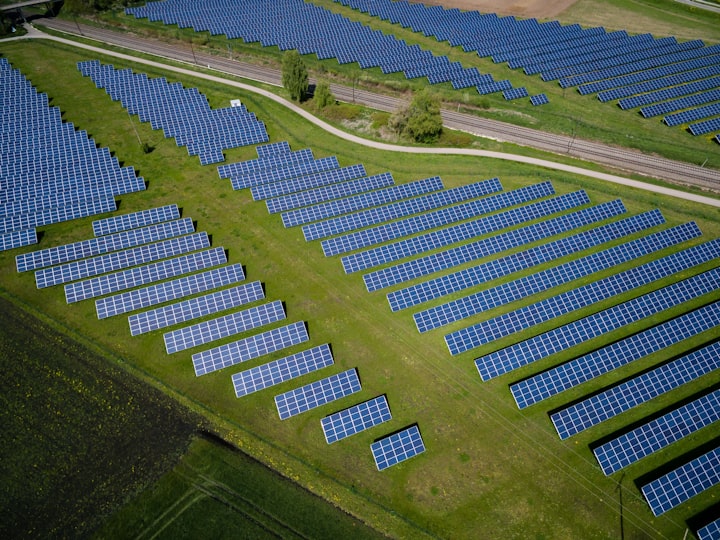
A handful of states are carrying the U.S. renewable generation momentum currently....
U.S. power generation since the early 2000's is visualized
It is apparent the U.S. power grid is a mosaic of demand and generation changes
A handful of states are carrying the U.S. renewable generation momentum currently....
A Picture Tells 1,000 Words
As seen by U.S. total generation, power demand hasn't budged materially in 20 years in the U.S. outside a few areas , largely due to efficiency gains
Everything in Texas is bigger, including power generation
Coal generation declines have moderated recently
There are few signs natural gas power generation growth has flatlined
Hydro and Nuke power have been mostly steady for decades
Meanwhile, renewable generation growth has gone parabolic in Texas
But growth outside the Big-3 (Texas, California, Washington) is seeing an uptick
Solar Generation is concentrated in California
While wind power is concentrated in Texas
Stay tuned for our 300-page state-by-state renewable report, coming shortly